Inflation Calculator A Simple Guide
Over time, currency buys less than before. Ten years ago, ₹100 had more reach than it does now. This shift reflects rising prices across goods and services. Instead of thinking in present terms only, consider what past amounts would equal today. Future costs appear higher when viewed through this lens. A tool designed for such shifts reveals these changes clearly. Past sums transform into current equivalents with little effort. Value fades quietly, yet steadily, year after year.
What is Inflation?
Back then, ₹20 bought one serving of chole bhature. Now, the price ranges between ₹80 and ₹100. Four times higher – this shift reflects inflation. Over time, each rupee buys less than before.
Understanding the Inflation Rate?
- India’s average yearly inflation: 5–7%
- Recent rate (2023–24): around 5.5%
Around 5.5 percent is how much prices increase annually
🇺🇸 Inflation Calculator
US Purchasing Power (1913–2024)
Understanding an inflation calculator
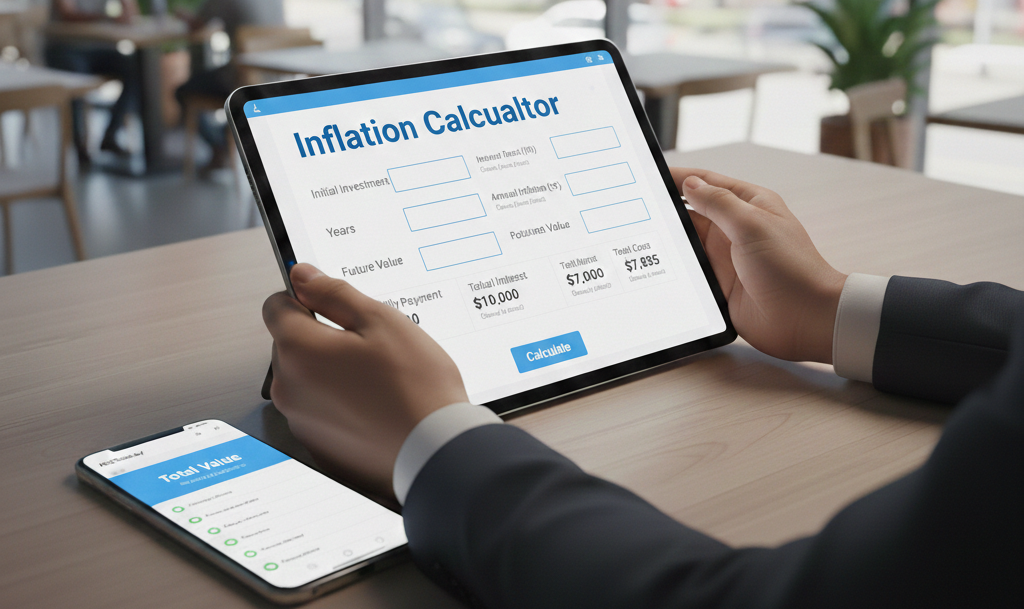
A calculation relies on one common equation. Entry requires exactly three inputs, nothing more. Though straightforward, each value matters equally. Without exception, precision affects results. Each field must be completed before proceeding
- Present Amount – The money you currently have
- Future span – The number of years ahead being considered
- A measure of how fast costs increase over time appears here. This figure shows price growth within an economy. Speed of rising expenses defines it clearly. What was once lower now climbs steadily onward
A Real Life Example About Retirement Planning
Rohit reaches thirty years of age. Retirement awaits when sixty arrives.
- Current monthly expenses: ₹50,000
- Years to retirement: 30 years
- Assumed inflation rate: 6%
Calculation:
Future monthly expenses after 30 years = ₹2,87,175
Exactly so. An item priced at ₹50,000 now may reach nearly ₹2.87 lakhs in three decades. This shift comes from inflation’s steady push. Over time, money loses ground while prices climb slowly ahead.
Why an inflation calculator helps with everyday decisions
- Essential for Retirement Planning
One might assume ₹1 crore suffices for retirement. Yet two decades onward, that sum may hold merely the value of ₹30–35 lakhs now. With time, purchasing power shifts silently beneath inflation’s pressure. What appears ample today risks falling short tomorrow. Numbers change meaning when measured across years. Value erodes even if amounts stay fixed. Future estimates require adjusting for hidden shrinkage. Present calculations often overlook long-term decay. Money does not age like people do – its strength fades without notice. - Accurate Goal Planning
Today’s engineering costs ten lakh rupees
After 15 years (at 6% inflation): ₹24 lakhs
The tool assists in setting aside an appropriate sum. One finds it useful for maintaining balance. With this method, adjustments become simpler. Accuracy improves when using such support. A proper figure emerges over time. This approach leads toward steady results. - Real Investment Returns Shown
A single percentage point remains when a fixed deposit’s gain of seven percent faces six percent inflation. Real growth shrinks under rising prices. Seven in earnings, yet just one after cost increases take effect. What appears substantial becomes minimal once economic pressure applies. Gains measured this way show less than they seem at first glance. - Reality Check on Salary Hikes
A rise in earnings of 8%, while prices climb 6%, leaves just a 2% gain in actual buying ability. Gains on paper fade when costs grow at the same time. What looks like progress often shrinks once price shifts enter the picture. Two percent remains after matching income growth against rising expenses. - Better Loan Decisions
A set monthly payment on a home loan can feel lighter later, even if income grows slowly. Over years, rising earnings help balance the cost. This shift appears clearly when projected forward. Comfort emerges not from lower payments, but from higher pay.

Manual vs. Inflation Calculator
Normal Calculator versus Inflation Calculator
Time Value of Money Not Considered Reflects Changing Worth Over Time
Future Planning Sometimes Wrong Estimates Better Cost Predictions
Investment Analysis Nominal Returns Real Inflation Adjusted Returns
When comparing across time, direct parallels fail. Values from earlier eras cannot align precisely with current ones. Adjusted figures reflect old amounts using modern purchasing power
Goal Setting Balances Needs With Practical Targets
Using an inflation calculator step by step
Planning for Education
- Child’s age: 5 years
- College at age 18 (13 years from now)
- Current cost of engineering: ₹12 lakhs
- Expected inflation: 7% (education inflation is usually higher)
Calculation:
Twelve lakh rupees grows by seven percent each year. After thirteen years, it becomes nearly twenty-nine lakh rupees. The total amount is found using compound growth. One sum leads to a much larger one over time. Math shows how values change across long periods
Understanding Purchasing Power Scenario Two
- Scooter price in 2000: ₹40,000
What now matches the value from 24 years ago, adjusted for 6 percent yearly inflation: - Today’s value = ₹40,000 × (1 + 0.06)^24 = ₹1,62,000
- Since scooters now cost ₹1 lakh+, they’re relatively cheaper compared to 2000.
Frequently Asked Questions
Q1: Is inflation the same for everything?
It depends. Each category carries its own rate structure. Some adjust higher, others remain fixed by comparison
- Education: 8–10%
- Healthcare: 7–9%
- Food: 5–7%
- Luxury items: 3–5%
Category-specific rates can be selected on certain calculators.
How Past Value Is Calculated?
Imagine today’s thousand rupees ten years earlier. With six percent yearly loss in value, it would buy more back then. That sum long ago held greater purchasing power. Think of past amounts gaining strength over time. What seems small now mattered much more before. Earlier money stretched further under such conditions
Past value equals one thousand rupees divided by one point zero six raised to ten, resulting in five hundred fifty-eight rupees
Inflation Is Not Always Positive?
Most of the time, that holds true. Though uncommon in India, deflation – meaning falling prices – can occur.
How to Calculate Real Return?
Real Return Adjusted for Inflation
FD returns slightly above inflation
Actual gain equals one point zero seven divided by one point zero six, minus one, resulting in zero point nine four percent.
Q5: How to compare salary increase with inflation?
If earnings rise by ten percent while prices climb six percent:
Actual growth results from dividing 1.10 by 1.06, then subtracting one, yielding 3.77%. Yield comes after adjusting the ratio downward by unity. Three point seven seven percent appears once computation finishes. One point ten over one point zero six sets the base. Adjustment follows division closely
Q6: What’s a good inflation rate to assume for India?
A figure of 6% represents the historical mean. When assuming caution, a value of 7% applies.
Which Calculators Are Accurate?
- RBI website (official rates)
Financial Sites Include BankBazaar And MoneyControl - Mutual fund portals
Housing Inflation Works Differently?
Yearly increases often range between eight and twelve percent. A distinct tool helps measure real estate value changes.
Inflation Impacts Vary by Income and Spending Habits?
It is true. Those with less income face greater impact, since a larger share goes toward essentials such as food and energy – areas where prices rise faster.
Q10: How to choose investments after adjusting for inflation?
Look at real returns:
- FD: 7% – 6% = 1% real
Twelve percent minus six leaves a difference of six. This gap reflects actual value after reduction
Beyond immediate gains, equities build value steadily. Wealth shaped over years favors these assets. Time strengthens their role in financial growth.
Practical Tips
- Test Multiple Scenarios
- Conservative: 7% inflation
- Moderate: 6%
- Optimistic: 5%
Choose a balanced approach.
- Different Goals Need Different Rates
For durations between one and three years, the figure stands at five percent
- Medium-term (4–10 years): 6%
- Long-term (10+ years): 7%
- Review Regularly
Frequent adjustments follow shifts in inflation trends. Every few years brings new numbers into focus. Changes accumulate slowly, then demand attention. Timing aligns roughly with economic cycles. Precision grows when reviews occur regularly. Outdated figures fade as fresh data arrives. - Build an emergency savings plan
Starting from a base of ₹3 lakhs for half a year’s costs now, the amount shifts upward when projected five years ahead. With inflation set at 6%, the future requirement reaches ₹4 lakhs. Time alters value, even when numbers seem steady at first glance.
Common Mistakes to Avoid
- Ignoring inflation completely
- Assuming too low an inflation rate
- Using the same rate for all goals
- Not updating calculations regularly
- Forgetting to adjust for tax on returns
Inflation Affects Each Investment Differently
Investment Returns Adjusted for Six Percent Inflation
|————|—————-|——————-|————-|
Interest grows at 3.5 percent yearly. Meanwhile, inflation subtracts 2.5 percent value across the same period. Over time, purchasing power shifts despite steady accumulation. Real gain emerges only after accounting for economic erosion. Value retention depends on this hidden adjustment.
| Fixed Deposit | 7% | 1% |
Debt Funds show a return of 8 percent. Volatility sits at 2 percent. Performance remains steady over time. Risk level stays low throughout the period. Returns do not fluctuate sharply month to month. Stability defines this investment type clearly
Twelve percent represents the return on equity funds. Six percent reflects a secondary measure tied to the same category. Performance varies across different assessment periods
Property investments show a ten percent return. Four percent reflects associated costs. Despite higher gains, expenses remain steady across reporting periods. Yield trends suggest moderate growth potential. Financial outcomes depend on market conditions during measurement intervals
Start today
- A choice must be made among digital tools that measure price changes over time.
- Consider your retirement figure – what amount might actually be required?
- Calculate future education costs for your children.
- Fine-tuned goals shift how much is set aside each month. Savings paths respond to changing priorities over time.
Final Note
Value of money fades over time without notice. With a tool that measures rising prices, vision into what comes next becomes sharper. Blind plans often follow when changes in price levels are overlooked. Wealth grows more reliably when shifts in purchasing power are recognized early.
A note upfront: what follows serves learning only. When managing personal money matters, professional guidance from a licensed financial expert should be sought. Consider this context before applying any part of the material presented here.
Disclaimer: This guide is for educational purposes. For personal financial decisions, please consult a certified financial advisor.

I am Yallappa Bichagatti and i’m seasoned financial professional with over 13 years of extensive experience in the banking and finance sector. Throughout his career, he has held key positions in Retail Banking, Wealth Management, and Corporate Finance, where he specialized in tax optimization, investment strategies, and large-scale portfolio management. Driven by a mission to bridge the gap between complex financial regulations and the common man, he founded karnatakaland.in to provide simplified, data-driven utility tools